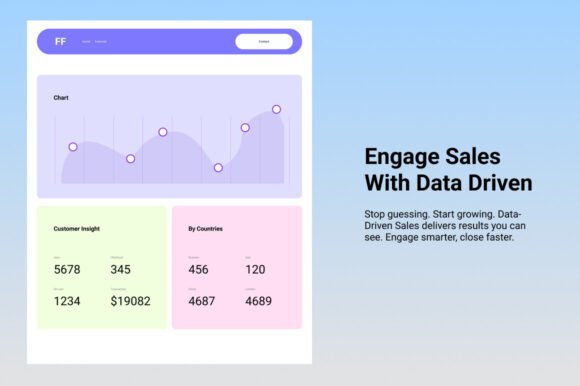
Transform Your Sales Dashboard with Gamification
Let’s be honest: staring at a static spreadsheet filled with sales figures can be soul-crushing. We spend hours generating reports that no one really wants to read, burying the actionable insights under layers of gray rows and columns. If you are a business owner, marketer, or sales manager, you know the struggle. You need a way to make that data jump off the screen, to turn "number crunching" into something your team actually looks forward to. This is where the concept of "Gamify Your Sales Data" comes into play, shifting the focus from mere tracking to interactive achievement. It is about taking those dry metrics and transforming them into a living, breathing dashboard that feels more like a mission control center than a filing cabinet.
Why Visuals Matter in Data Analytics
When we talk about gamification in a professional context, we aren't suggesting you turn your quarterly review into a game of *Call of Duty*. Instead, we are borrowing the psychological triggers that make games engaging—progress bars, tiered achievements, and visual feedback loops—and applying them to your business strategy. A gamified dashboard allows you to visualize KPIs not as static numbers, but as progress toward a goal. Think of it as the difference between reading a book about climbing a mountain and actually seeing a map of your ascent with flag markers showing how close you are to the summit.
The visual style required for this kind of interface needs to be distinct. It requires a typography choice that balances professionalism with a spark of energy. You need a typeface that commands attention for the big wins but remains legible for the fine print. This is where the specific aesthetic of a tool like the "Gamify Your Sales Data" dashboard template shines. It utilizes a modern typography approach that feels fresh and technical. The design relies heavily on contrast—clean, sans serif fonts for data points to ensure maximum readability, paired with bolder, more expressive display fonts for headers and achievements.
By incorporating these elements, you change the personality of your data. It stops feeling like a chore and starts feeling like a challenge worth tackling. The visual hierarchy guides the eye naturally from the overview down to the specific details, ensuring that the most critical numbers—the ones that drive your revenue—get the spotlight they deserve.
Practical Applications for Creatives and Entrepreneurs
You might be wondering how a data-centric design concept applies to you, especially if you are a crafter, a blogger, or a graphic designer. The truth is, visualizing progress is universal. For a small business owner, this approach is perfect for your internal team meetings. Instead of reading off a list of numbers, you can display a dynamic dashboard that highlights the "MVP" of the month or shows the team's progress toward a collective goal. It boosts morale and fosters a bit of healthy competition.
For content creators and marketers, the "Gamify Your Sales Data" concept extends to client reporting. Imagine sending a client a monthly report that doesn't just list engagement rates but visualizes them as a growing ecosystem. It makes your work look more sophisticated and demonstrates value in a way that is instantly recognizable. It turns a standard deliverable into a piece of editorial design.
Even in packaging design or brand identity work, understanding how to present information playfully is a massive asset. If you are designing a loyalty program for a coffee shop or a rewards system for an e-commerce store, the principles of gamification are your best friend. You can use bold, punchy typefaces to highlight rewards and create a sense of excitement around the purchase history. It is about using creative font choices to inject personality into the transaction.
Choosing the Right Typography for Impact
When you are building a dashboard or a presentation with a gamified feel, your font choice is the linchpin. You are looking for a premium font family that offers versatility. You need a sans serif font that is geometric and clean for the numbers—because if your sales figures look muddy, you have a problem. However, for the headers and "achievement unlocked" moments, you might want something with a bit more weight or flair.
While the "Gamify Your Sales Data" interface often utilizes a specific modern aesthetic, you can adapt this to your own brand. If your brand leans more traditional, you might pair a classic serif font with a modern sans serif to bridge the gap between authority and innovation. If your brand is more whimsical, perhaps a handwritten font or a script font for accents can soften the corporate edge of the data.
The key is font pairing. You want a typeface that serves as a reliable workhorse for the body copy and data points—something that renders well on screens of all sizes, from a desktop monitor to a mobile phone. Then, you pair it with a display font that has enough character to stand out but doesn't distract from the information. This balance ensures your web design or presentation remains professional while still being engaging.
Implementation and Design Assets
Getting started with this style doesn't require you to be a coding wizard. There are plenty of design assets available that mimic the dashboard aesthetic. Look for UI kits or templates that focus on data visualization. When evaluating these, pay attention to the included styles. Do they offer dark mode and light mode? Dark mode often feels more "techy" and immersive, which fits the gamified vibe perfectly, but light mode is essential for readability in bright environments or for printing.
Readability is the golden rule here. No matter how cool your dashboard looks, if the user has to squint to read the monthly revenue, the design has failed. Ensure that your commercial font license allows for web embedding if you are building a live dashboard. Test your color contrasts—often, gamified dashboards use neon accents against dark backgrounds, which looks great but needs to be checked for accessibility standards.
Finally, think about the narrative. Data is just raw material; the story is what matters. By gamifying your sales data, you are not just tracking performance; you are creating a narrative of growth. You are turning a static report into a dynamic journey. Whether you are presenting to investors, motivating your staff, or simply trying to make sense of your own business trajectory, treating the data like a game board makes the process more human, more engaging, and ultimately, more effective. It is a strategic shift from "monitoring metrics" to "celebrating wins," and that shift can make all the difference in how your team perceives their work.